GraphLab
GraphLab teaches basic principles and skills for graphing. The program is divided into four
lessons: scaling, drawing a "best-fit" straight line, errors, and least-squares fit.
Scaling: Requires students to set the scales for graphs in which the variables that
involve direct and inverse proportions and in which the scale involves exponents. Students
must provide equally spaced intervals.
Best Fit Line: Students move a line with the mouse and place it so that the best fit
of the data is obtained. The slope of the line must agree within 5% of the calculated
least-squares-fit line.
Errors: Scientific data can contain either random and/or systematic errors. In this
lesson, students must place the line to give a best fit and then decide based on the
phenomena being described what kind of errors the data contain.
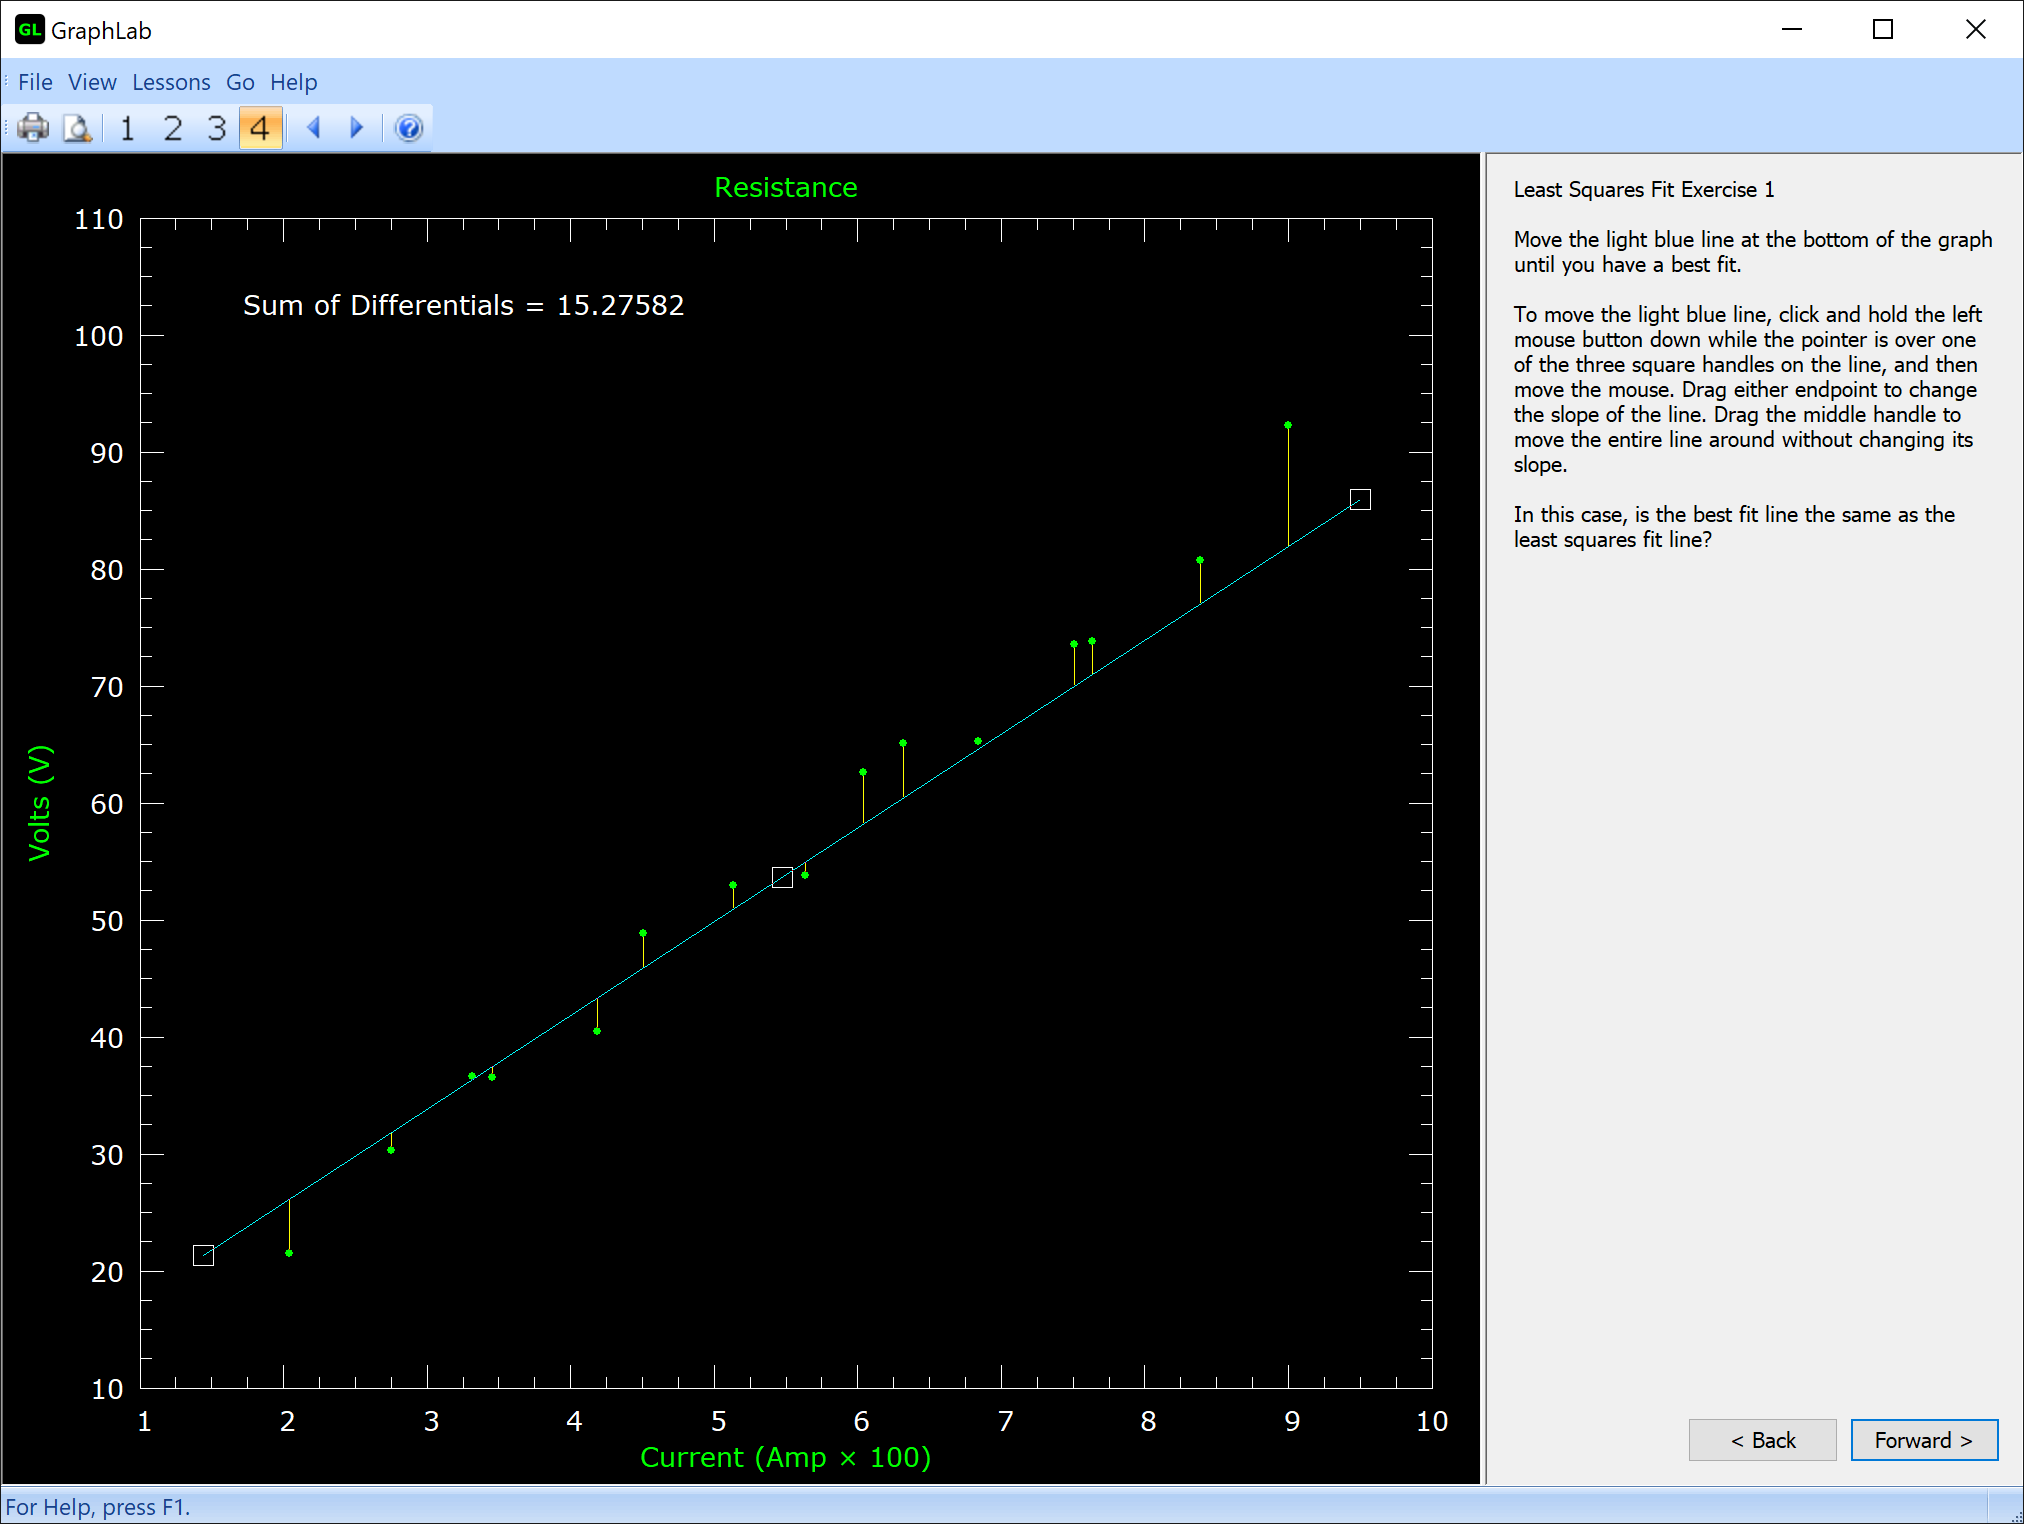
Least Squares Fit: In this lesson, students draw the least-squares line by minimizing
the sum of the squares of the differentials, which is shown on the screen as they place
the line on the data. The differentials are also shown to provide a visual sense of the
minimization. Finally, students are confronted with an "outlier" when they are drawing
the least-squares line. In each section students are presented with clearly stated
principles and guidelines for graphing illustrated in an accompanying graph of real data
from various science subject areas. Following each new principle, students are asked to
summarize and evaluate that information. This informative phase is followed by an exercise
phase in which students practice the skills.
Setup program
GraphLab requires a computer running the Microsoft Windows 8,
Windows 10, Windows 11, or later Windows operating system.